Supplemental Light
Courtesy of the many “culture guides” available on the internet, such as those issued by the American Orchid Society, The Baker’s, or individual growers, we can often find out reasonable target light levels for our plants. Likewise, we can translate those recommendations into the lower levels required when growing plants only under artificial light sources. Unfortunately, there is very limited information available about determining the amount of supplemental light might be needed to compensate for winter’s reduced sunlight, that high-rise next door, or the leafing-out of that big tree by your window. Before we can estimate how much light to add, we must determine what the plant is currently getting. By using a light meter and a few minutes of time periodically during the course of a day, we can make a pretty good guess. First let’s consider how natural sunlight works in relation to our plant’s needs.
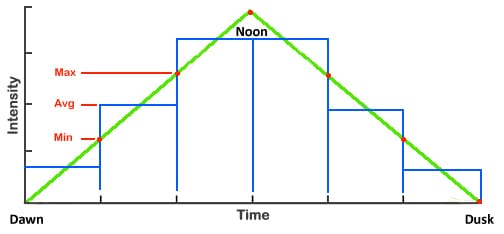
Natural sunlight intensity starts at zero just before dawn, reaches a peak at noon and then fades back to zero at dusk. As we have shown, that “intensity curve” can be estimated by a triangle.
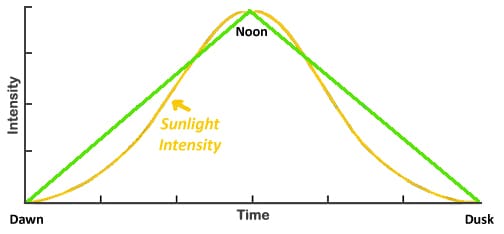
The amount of light that a plant receives is the area under the curve, a product of intensity x time, which can easily be calculated from the triangle at 1/2 base x height, or in this case 1/2 hours x maximum intensity. As culture guides typically provide the maximum recommended light level for a plant, if we use 100% artificial lighting at constant intensity, we need only provide one-half that intensity for the same time period. So how can we use that to find out how much supplemental light we’ll need? With the help of a light meter, and periodic readings, it’s actually quite simple!
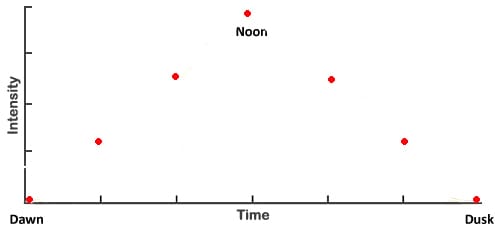
Start by taking light-level readings are fixed intervals throughout a day. The more frequent the better, but we’ll use two hours over a 12-hour day in this example. Starting with zero at dawn, we can plot the light intensity every two hours until it reaches zero at dusk again.
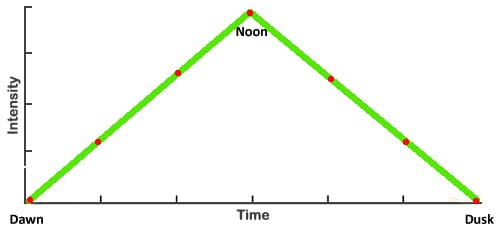
Connect the dots to form a triangle. Don’t be concerned if the sides are not straight.
Then draw vertical lines up from the time interval axis on the bottom.
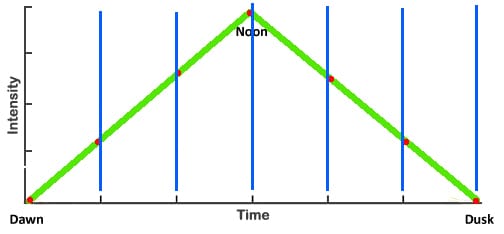
Now estimate the halfway point on the plot between each vertical line and draw horizontal lines. Each rectangle or “block” (figure 3a) represents the intensity x time for each two-hour period.
Using the vertical intensity scale on the left, measure the height of each block.
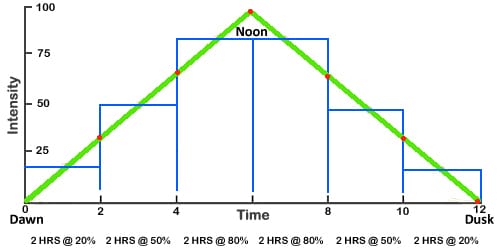
Multiply the hours for each block by the decimal equivalent of the intensity percentage and sum them:
2 x 0.2 + 2 x 0.5 + 2 x 0.8 + 2 x 0.8 + 2 x 0.5 + 2 x 0.2 = 6
Now divide that by the 12-hour duration:
6 / 12 = 0.5
Confirming that our estimated average intensity is 50% of the peak.
That example used full sunlight to demonstrate the technique, but what happens if we have a southwest-facing window with other obstructions to the incoming light, and we use actual light-meter readings for the intensity? Lucky for us, this technique still applies!
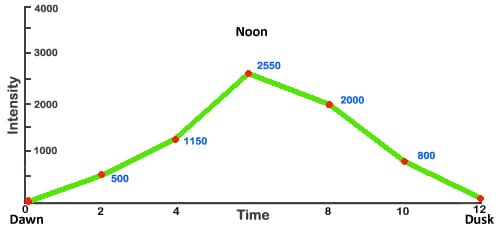
By creating a simple chart of the light intensity measurements we have taken and using the average for each two-hour period, we can apply similar logic and simply calculate the average light intensity. (I have used foot-candles, as many folks have meters in those units, but this applies with any light intensity units.)
Hours | Start | End | Average | x 2 hrs |
0-2 | 0 | 500 | 250 | 500 |
2-4 | 500 | 1150 | 825 | 1650 |
4-6 | 1150 | 2550 | 1850 | 3700 |
6-8 | 2550 | 2000 | 2275 | 4550 |
8-10 | 2000 | 800 | 1400 | 2800 |
10-12 | 800 | 0 | 400 | 800 |
SUM= | 14000 | |||
SUM/12= | 1167 |
If, for example, we are growing cattleyas, for which the peak recommended light intensity is 3000-5000 foot-candles, that’s the equivalent of 1500-2500 foot-candles applied continuously, so our natural lighting is apparently some 333-1333 foot-candles shy of the preferred range. Be sure not to add so much that your natural-plus-supplemented light intensity exceeds the highest recommendation, so you won’t burn your plants. In this case, we can safely add about 1000 foot-candles, turned on at dawn and off at dusk, increasing the average light intensity to 2167 foot-candles, while reaching 3550 at noon, perfect for happy cattleya plants!