TDS & EC
As we gain more and more knowledge about water- and nutrient chemistry and their effects upon the growth of our plants, many acquire a variety of meters for controlling the nutrient solution, with pH and TDS meters being common.
A pH meter, if properly maintained and calibrated, gives a pretty straightforward reading, but unfortunately, TDS meters are not so good.
A TDS meter is really just an electrical conductivity (EC) meter that has a built-in conversion factor that displays the output in parts per million (ppm) of total dissolved solids (TDS). The trouble is that the relationship between the conductivity of a solution and its content varies not only by the concentration of the dissolved ions, but is also based upon the charge and mobility of the dissolved ionic species.
As a very simplified explanation of that, imagine a small ion and a large ion having the same electrical charge. The small ion will find it easier to move in the solution, so “conducts” that charge faster, so gives a higher EC for the same concentration (TDS) in the solution. Likewise, if two ions have the same size, but one has a higher charge than the other, it too will show a higher EC.
A commercial fertilizer can be made up of dozens of different chemicals, each of which ionizes and contributes to the EC of the solution, and different brands of fertilizer can use different chemicals to make up the total formula. With all of that variability, how can a single “constant” conversion factor be valid?
I own two TDS meters – a Hanna TDS1, and a HM Digital TDShm. When placed in the same solution, they give different apparent TDS values. In order to know which I should trust, or in reality – what is the true value when I use either of them – I used the following technique to calibrate them.
As the TDS meter is really just and EC meter, I purchased a standard conductivity solution from a laboratory supply company. Using that, I can see what the TDS reading is at a known EC.
Let’s use the Greencare Orchid Special for RO formula as an example. The producer provides the EC versus PPM N that the formulation adds to the overall EC of a water solution. With both of my meters, my freshly-produced RO water gives a TDS between 0 and 4 ppm, so I simply assumed it to be 0 for my purposes.
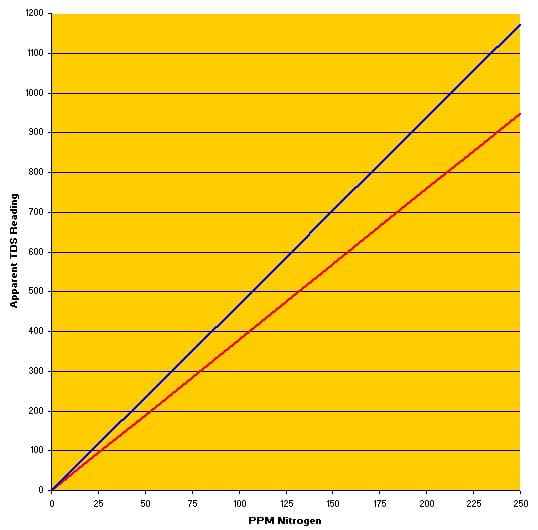
By knowing what the two meters read at a known EC with the standard, and then measuring the value for fertilizer solutions having a known EC-PPM N relationship, I was able to construct TDS-EC calibration curves for each of my meters – Hanna TDS1 represented by the red line, the TDShm by the blue line.
If I typically shoot for about 100 ppm N in my fertilizer solution, I simply use my TDS meters as a check, knowing that the Hanna TDS1 should show between 380 and 400 ppm TDS, while the TDShm should be in the 475 to 500 range. For reference, the true TDS – the concentration of this fertilizer formula added to the water for 100 ppm N – is 769 mg/kg or 769 ppm.